The Psychology Behind Chart Patterns: Why They Work
In trading, some consider chart patterns to be nothing more than technical abstractions—shapes on a chart that in some way "forecast" the future. But experienced traders are aware that much more is at work under the surface. Chart patterns are not magical or mystical. They are graphic imprints of collective human psychology unfolding in money markets. Knowing the psychological concepts underlying these patterns can make a big difference in your trading advantage and judgment.
What are Chart Patterns?
Chart patterns refer to the identifiable patterns that form from the price action of an asset over a period. They can be divided into reversal patterns (such as Head and Shoulders, Double Tops/Bottoms) and continuation patterns (such as Triangles, Flags, and Pennants). Traders utilize these patterns to spot possible future price behaviour, e.g., a trend continuing or reversing.
These patterns repeat themselves throughout time periods and
asset classes because they manifest something universal: the aggregate behaviour
of market participants.
The Psychological Core of Market Movement
Each candle on a chart is a tug of war between buyers and sellers. That tug of war is driven by human emotion—fear, greed, anxiety, hope, regret, and excitement. Chart patterns are merely the consequence of this emotional tug of war. Here is a closer examination of the psychological forces that create these patterns:
1. Fear and Greed: The Emotional Drivers of the Market
Greed and fear are two of the most pervasive emotions that drive market choices.
Greed pushes prices up. More speculators enter in anticipation of making a profit, and demand drives prices up. This can be observed in ascending triangles or bullish flags, where the buying power is maintained.
Fear induces declining prices. Panic selling on bad news or perceived risk in the market can result in descending triangles, bearish flags, or sudden breakdowns.
Patterns emerge since these emotions do not happen in vacuums. When many traders respond emotionally, the market acts according to known patterns
2. Herd Mentality and Groupthink
Humans are social animals. In trading, it manifests as herd behaviour—people imitate the majority. When a chart displays a price breaking through resistance, most traders take it as a bullish indication and go long. This action consolidates the breakout, driving the price even further up.
This is the reason why such patterns as breakouts, triangles, and cup and handles tend to work. As soon as a pattern is known and accepted by many, it becomes a self-fulfilling prophecy. Folks trade the pattern because they figure others will, and in trading, they make the move they anticipated.
3. Support and Resistance: Memory in the Market
Chart patterns tend to orbit around support and resistance levels—places where the price has tended to struggle moving above (resistance) or below (support).
These levels are there due to market memory. If investors purchased an asset at a price and it declined, they can try to sell it back when it gets back to that price just to cover the cost. Others can recall steep drops from a particular level and are reluctant to purchase again at those levels.
This is what creates areas where price keeps reacting in cycles, creating patterns such as:
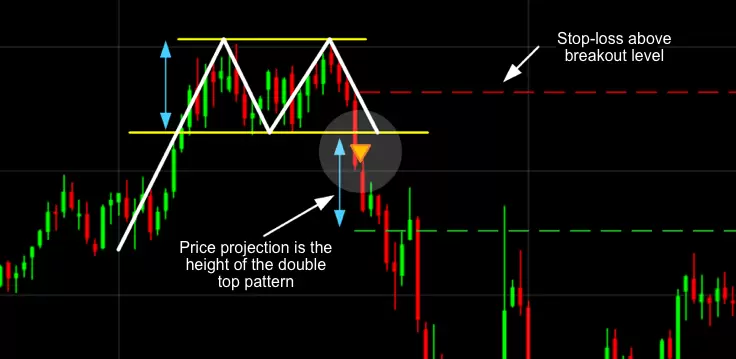
Double tops
(resistance tested twice)
Double bottoms
(support tested twice)
Range-bound consolidation (trading in support and resistance)
The psychology is straightforward: individuals remember, and they respond to their prior experience.
4. Hope, Despair, and Denial: The Emotional Arc of Patterns
Consider the Head and Shoulders pattern, for instance:
The left shoulder
develops as prices rise and fall—early optimism.
The head is a last
push higher—buyers expect a breakout.
The right shoulder
reflects declining strength—doubt creeps in.
The neckline break verifies a reversal—reality dawns, and many traders throw in the towel.
And so do Double Top formations indicate a market's inability to break a past high, marking the demise of a trend as buyers lose heart and sellers gain the upper hand. These are not merely patterns—they are tales of collective psychology playing out
Why Patterns Repeat Across Time and Markets
Some skeptics argue that if everyone knows about chart patterns, they should stop working. But the truth is more nuanced.
1. Human Psychology is Stable Over Time
Our emotional responses to risk, reward, and uncertainty haven't changed for centuries. Whether it's tulip bulbs or Bitcoin, the same behaviours—panic, euphoria, regret—drive our actions.
2. Institutions Use Them, Too
Most large institutional traders use technical analysis in their trading. When institutions move on patterns, their big positions can create large price movements, confirming the pattern for others.
3. Algorithms and Quant Models See Them
Most trading algorithms are designed to spot and respond to recognized chart patterns. This leads to feedback loops where price action confirms the anticipated consequence of a pattern.
4. Patterns Offer Probabilistic, Not Predictive, Insights
A chart pattern doesn't guarantee an outcome, but it offers a probability based on historical behaviour. This edge is what traders seek
⚠️ Patterns Aren’t Fool proof
While chart patterns provide a statistical advantage, they are not risk-free. Markets can shift on news events, earnings, geopolitical surprises, or surprise shifts in sentiment. These will trigger false breakouts, failed patterns, and whipsaws.
The trick is to apply chart patterns together with:
- Volume confirmation
- Risk management (stop
losses, position sizing)
- Fundamental analysis
(for context)
- Market context and trend strength
Don’t rely solely on patterns—use them as part of a broader trading plan.
Conclusion: Think Beyond the Chart
Chart patterns are not about lines, shapes, or formulas. They're about understanding what real people are doing—and why. Every breakout is fueled by excitement. Every breakdown is driven by fear. Each support level is held up by memory and past pain. By reading a chart, you’re reading human behaviour.
Knowledge of psychology in chart patterns isn't only going to make you a more skilled trader—it'll save you from being one of the pack caught off guard.
Trade knowingly. Trade compassionately. Above all, trade by discipline.


