

Day trading has been one of the interesting and fast-paced ways one can invest in the capital market. Traders engage ....
Day trading has been one of the interesting and fast-paced ways one can invest in the capital market. Traders engage ....
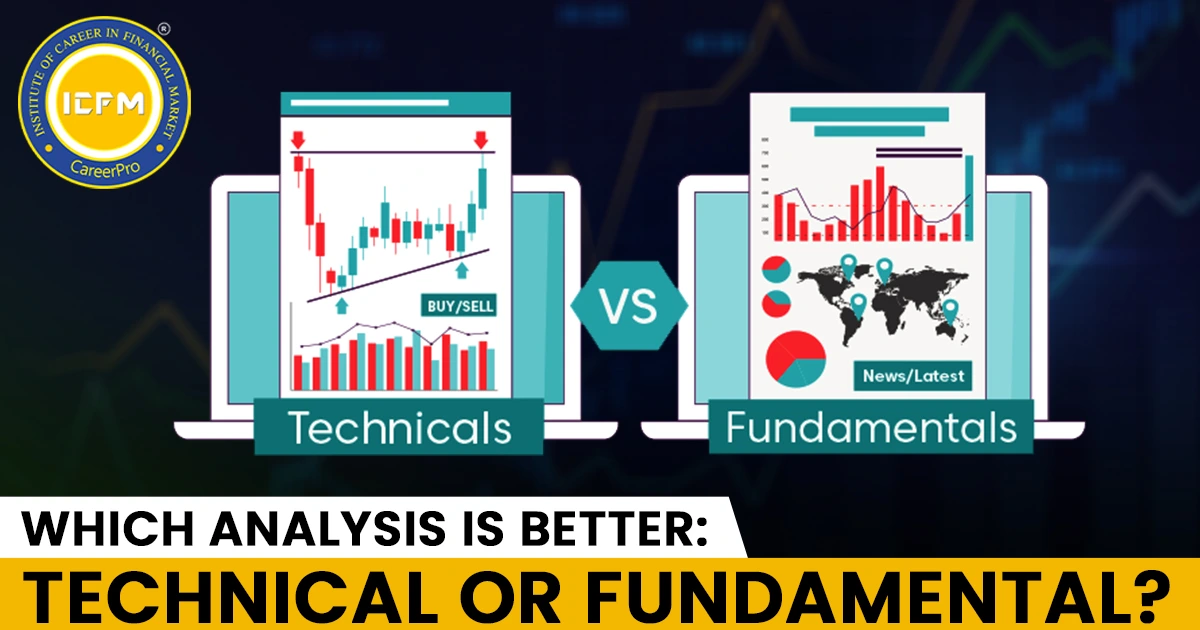
When investing in the stock market, the key question is which evaluation method to use: Technical analysis or Fundamental analysis? ....

A trading journal is essential for success. It helps traders track performance, learn from mistakes, and improve. It's a key ....
शेयर बाजार में सफल होने के लिए सही रणनीति चुनना बेहद जरूरी है। लेकिन यह सवाल हमेशा बना रहता है: ....
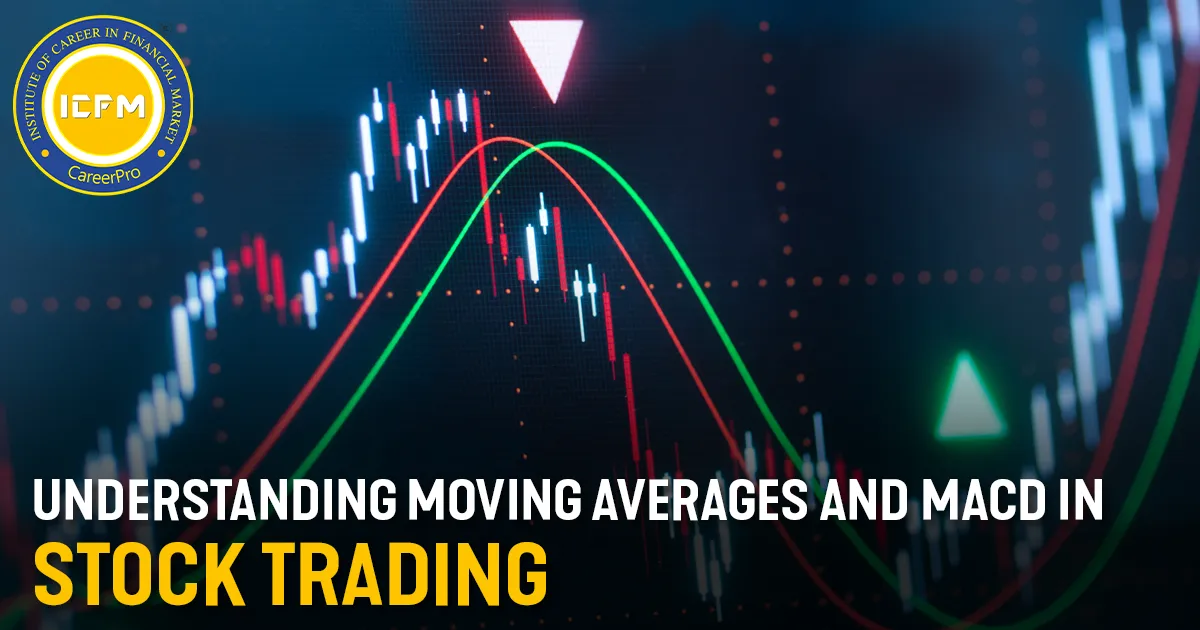
Moving averages and the Moving Average Convergence/Divergence (MACD) indicator are essential tools for stock market technical analysis. They help identify ....
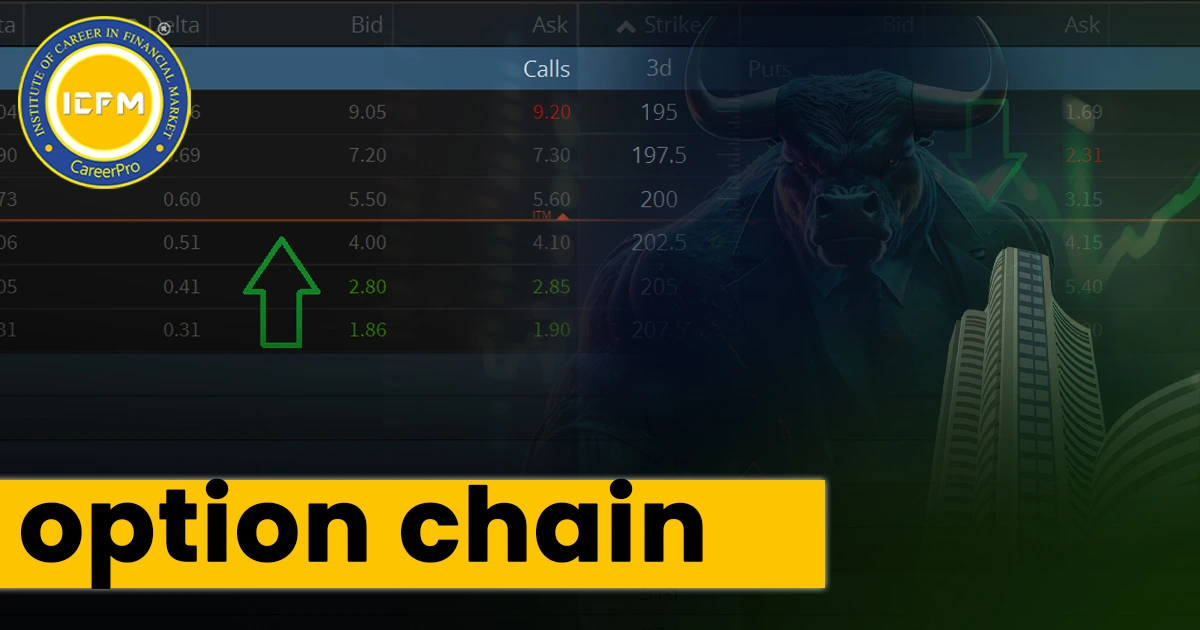
An option chain shows all available options contracts for security, including strike price, volume, open interest, and implied volatility for ....
Gaps occur when the closing price of one day and the opening price of the next differ, signalling market sentiment ....
शेयर बाजार में निवेश करना जितना रोमांचक होता है, उतना ही चुनौतीपूर्ण भी। यहां केवल खबरों पर भरोसा करना या ....
Technical indicators are tools that help traders analyze trends and predict price movements. Learn 7 indicators to build your trading ....
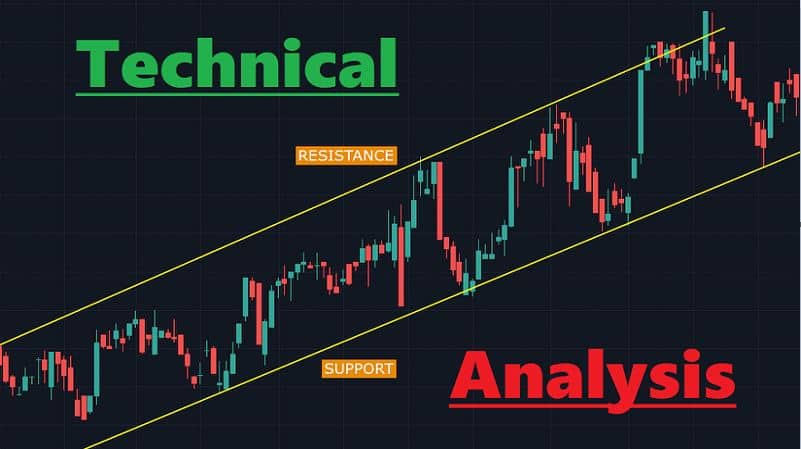
Technical analysis (TA) is a powerful tool for traders and investors, but even experienced traders can make common mistakes that ....
